Oracle 19c “library cache load lock”
Before we start I want to apologize from two of my teachers(masters), Ferhat Sengönül and Tugrul Tekin Doyuk. Because instead of using scientific and methodological techniques they taught me I just wanted use easy way. Of course it led me to wrong results. Then using the right method I was able to reach to nirvana(what kind of nirvana this is?).
Our problem was we were having lots of “ORA-00018: maximum number of sessions exceeded” entries in the alert log file. At the first glance it might be seen as wrong configuration problem and we need to change #maximum sessions. Yet, surprise comes here. When I checked v$session for my monitoring user I listed lots of “library cache load lock” errors.

Then I tried to find locked object by using(https://smarttechways.com/2021/02/24/library-cache-load-lock-in-oracle/):
select to_char(SESSION_ID,’999') sid ,
substr(LOCK_TYPE,1,30) Type,
substr(lock_id1,1,23) Object_Name,
substr(mode_held,1,4) HELD, substr(mode_requested,1,4) REQ,
lock_id2 Lock_addr
from dba_lock_internal
where
mode_requested = ‘None’
and session_id in
(select sid from v$session_wait where wait_time=0 and event like ‘%library cache%’) ;
But, my query was also being blocked by same the “library cache load lock” event. So, which session was causing this problem? In order to point out this I just used(There is a good recursive query that list the sessions by their relationship(I took it from Tugrul Tekin Doyuk) but I will use primitive way because of small amount of sessions):
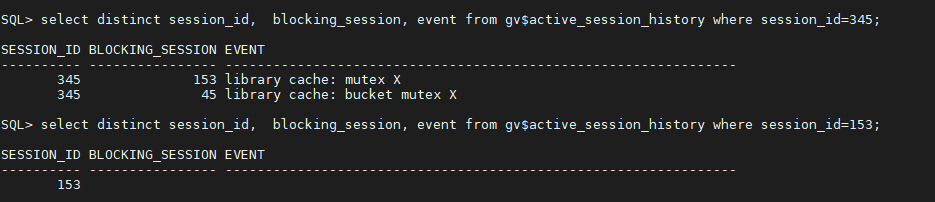
I did not take into account the session with sid = 45 because it was one my session and the problem was not a deadlock. So, I need to check sessiod with sid =153.
What is this session doing, is it blocked by another session? Hopefully, not:). Then I checked sql_id:

Our notorious sql_id, 0za9fv0j1vgkk(for me of course :) ). Let’ s try to find out sql_text.
select SQL_FULLTEXT from v$sql where sql_id = ‘0za9fv0j1vgkk’ ;Want to guess the result:)? Nothing, it was also blocked by same the “library cache load lock” event. Also, the session belongs to “SYS”, Oracle itself. I mustn’ t(can’ t(shouldn’ t)) kill it:).
While I was checking sqltext the instance crashed:
MMON (ospid: 1726): terminating the instance due to ORA error 472
2022–01–07T10:49:07.791280+01:00
Cause - 'Instance is being terminated due to fatal process PMON being dead.'
2022–01–07T10:49:08.196524+01:00
ORA-1092 : opitsk aborting process
2022–01–07T10:49:08.212204+01:00
After instance opened, I was able to check what was the sqltext and it starts:
WITH MONITOR_DATA AS (SELECT * FROM
TABLE(GV$(CURSOR( SELECT USERENV(‘instance’)
AS INST_ID, KEY, NVL2(PX_QCSID, NULL, STATUS) STATUS,
FIRST_REFRESH_TIME, LAST_REFRESH_TIME, REFRESH_COUNT,
PROCESS_NAME, SID, SQL_ID, SQL_EXEC_START,SQL_EXEC_ID,
DBOP_NAME,DBOP_EXEC_ID, SQL_PLAN_HASH_VALUE, SQL_FULL_PLAN_HASH_VALUE,
SESSION_SERIAL#, SQL_TEXT, PX_SERVER#, PX_SERVER_GROUP,PX_SERVER_SET,
PX_QCINST_ID, PX_QCSID,
CASE WHEN ELAPSED_TIME < (CPU_TIME+APPLICATION_WAIT_TIME + CONCURRENCY_WAIT_TIME+ CLUSTER_WAIT_TIME+USER_IO_WAIT_TIME+ QUEUING_TIME)
THEN (CPU_TIME+APPLICATION_WAIT_TIME+ CONCURRENCY_WAIT_TIME+ CLUSTER_WAIT_TIME+ USER_IO_WAIT_TIME+ QUEUING_TIME)
ELSE ELAPSED_TIME END ELAPSED_TIME, QUEUING_…
I checked also related trace files and found stacks:
ksedsts()+426<-kspol_12751_dump()+168<-dbgdaExecuteAction()+354<-dbgerRunAction()+83<-dbgerRunActions()+1352<When I searching sql_id, sqltext and stacks I found these three results:
Doc ID 1912230.1-
Doc ID 2253323.1-
Doc ID 2102131.1-
Luckily, my old teammate, Ferhat Gülerce who works in a bank told me they had this error before me. Executing:
alter system set “_report_capture_cycle_time”=0; /* Default is 60 seconds */solves this error(at least until now:) ).
If there is something wrong please let me know!
Thanks!